Contact Us
The Kingsmen Experience
22 Changi Business Park Central 2
Singapore 486032
t. (65) 688 000 88
e. info@kingsmen-int.com
We are committed to providing timely, high quality information to investors on the internet. Whether you are interested in key performance ratios, financial news and results, we hope that you will find what you need readily here.
About Kingsmen
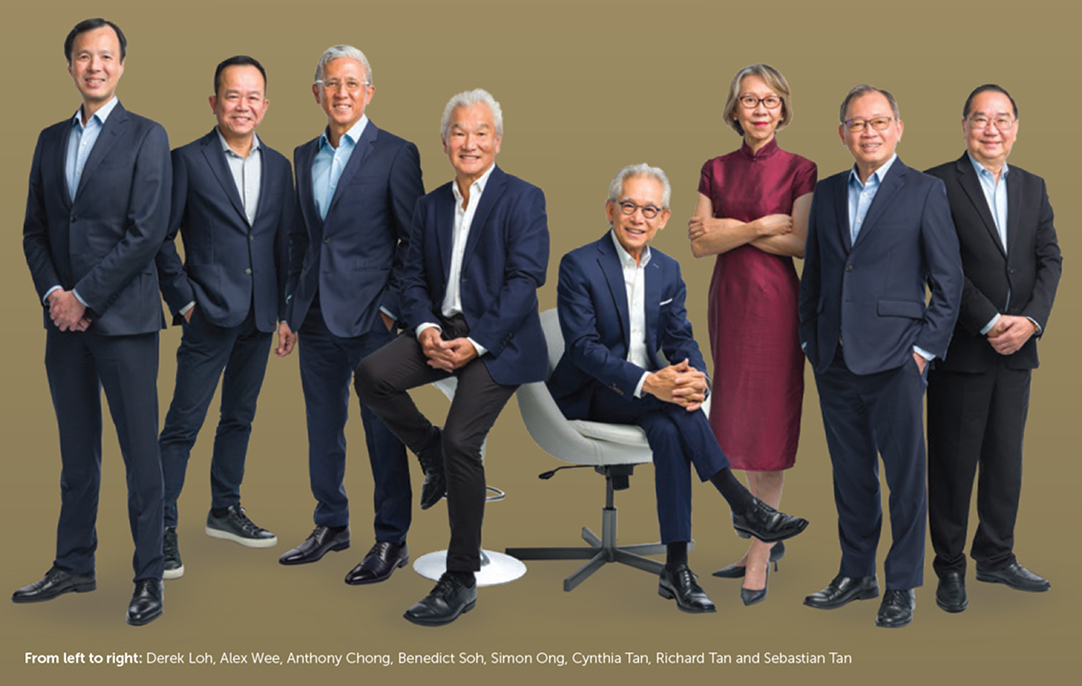
Established in 1976, Kingsmen is a leading creator of experiences, with a global network of offices and full service facilities serving global clients in Events & Exhibitions, Thematic & Attractions, Retail & Corporate Interiors, Research & Design, and Experiential Marketing.
Contact Us
The Kingsmen Experience
22 Changi Business Park Central 2
Singapore 486032
t. (65) 688 000 88
e. info@kingsmen-int.com
Extracted from Annual Report 2025
Dear Shareholders,
After several challenging years following the COVID-19 pandemic, we are beginning to see renewed momentum across our markets. During the year, we successfully completed a number of significant projects, reflecting the growing demand for meaningful and engaging experiences. Today, audiences are increasingly seeking authenticity, relevance, and deeper connections. Across our sectors, we continue to see demand for experiences that integrate design, storytelling, and technology in more intentional ways. This shift reinforces the strength of our integrated capabilities and our ability to translate strategy into environments and engagements that resonate.
Over the year, we strengthened our core competencies while refining collaboration across divisions. By aligning research, design, production, and delivery more closely, we have enhanced our agility and embedded innovation more deeply throughout the value chain. We remain committed to investing in talent, nurturing leadership, and fostering a culture grounded in curiosity, craftsmanship, and continuous improvement.
Sustainability remains central to our long-term strategy. As expectations rise among clients and communities, we are taking concrete steps to reduce environmental impact, strengthen governance practices, and create positive social outcomes through our work. During the year, we were awarded the silver rating by EcoVadis, reflecting progress in our environmental, social, and governance practices. We believe responsible growth and commercial success must go hand in hand.
As we celebrate Kingsmen's 50th anniversary in 2026, this milestone invites reflection on how far we have come and, more importantly, how we must continue to evolve. The foundations built over the decades position us well for the next chapter. By staying attuned to market shifts, embracing technological advancement, and deepening client partnerships, we are confident in our ability to remain relevant and resilient.
In line with the Group's policy of rewarding shareholders, the Board of Directors has proposed a final dividend of 3 Singapore cents per ordinary share.
On behalf of the Board of Directors, I would like to express my sincere gratitude to our management team and employees for their commitment, as well as to our clients, partners, and shareholders for their steadfast support. Together, we will continue building enduring value for the years ahead.
Benedict Soh is dedicated to honing the Group's leadership capabilities and human capital, in addition to his role in charting the Group's strategic direction and exploring new business opportunities. One of two founders of the Group, he has contributed significantly to its growth and has over 50 years of experience in the design & production of interiors, exhibits and marketing communications. Benedict has contributed his services to relevant Government agencies for various initiatives to improve Singapore’s international standing in Tourism & Exhibition Services.
A strong proponent of education, Benedict is the Chairman of the MDIS School of Tourism & Hospitality Industry Advisory Board and a member of its Academic Board. In 2014, US-based Exhibit Designers & Producers Association (EDPA) conferred the prestigious Hazel Hays Award in recognition of Benedict’s outstanding contributions to the trade show industry, in addition to the Lifetime Achievement for Outstanding Contribution to Tourism accorded by the Singapore Tourism Board in 2012. Benedict holds a Master of Business Administration from the University of Hull, UK.
Simon Ong Deputy Chairman
Simon Ong oversees the strategic planning and development of the Group as well as its creative and brand standards. He is one of the Group's two founders and has contributed significantly to its growth. He is actively serving the creative industry and is currently a honorary advisor to the Society of Interior Designers Singapore, a member of Singapore Interior Design Accreditation Council and an ambassador of the Red Dot Design Award. Simon served as Chairman of the design cluster in the Manpower, Skills & Training Council of WDA, President of the Interior Designers Association, an IDP member of the Design Singapore Council, and an advisory board member to the Design Business Chamber of Singapore and Singapore Furniture Industries Council (Design). In 2024, he was awarded The Lifetime Achievement by the Society of Interior Designers Singapore for his countless contributions to the design industry. On the international front, he served as a board member of SHOP!, a global trade association dedicated to enhancing retail environments and experiences. In 2019, he was inducted into the SHOP! Hall of Fame in recognition of his significant contributions to the industry.
An ardent advocate of education, Simon currently serves as a board director of Nanyang Academy of Fine Arts (NAFA). He served as a member of the Advisory Board to the School of Design & Environment at the National University of Singapore (NUS) and Temasek Polytechnic School of Design, and a member of Design Education Review Committee, Singapore (DERC). He was the former Chairman of the School Advisory Board of Cedar Girls Secondary School, and Vice-Chairman of the Potong Pasir CC Management Committee. He was awarded a Master in Design from the University of New South Wales, Australia, and a Master of Business Administration from the University of South Australia.
Anthony Chong Group Chief Executive
Anthony Chong is responsible for the strategic leadership, corporate governance, and operational management of the Group's diverse portfolio, encompassing Retail, Theme Parks, Museums, Exhibitions, Events, and Attractions. With over 40 years of expertise in marketing and multi-disciplinary project execution, Anthony has successfully delivered world-class attractions, tradeshows, retail interiors, and large-scale sporting and corporate events. He holds a Master of Business Administration from Victoria University of Technology, Australia, and brings a wealth of experience to drive sustainable growth and innovation across the Group.
Alex Wee Group Managing Director
Alex Wee assumed the role of Group Managing Director on 1 January 2026. Previously, he served as Group Managing Director, Retail & Corporate Interiors. In his current capacity, Alex works closely with the Group Chief Executive in the strategic management of the Group, with a focus on the Group's Retail & Corporate Interiors business and the Greater China offices.
Alex has more than 30 years of experience in the fulfilment of retail & corporate interior fit-outs, custom fixture manufacturing, and general contracting. He has a Bachelor of Construction Management (Honours) from University of Newcastle, Australia, and a Master of Science in Marketing & Consumer Insight from Nanyang Technological University, Singapore.
Sebastian Tan Non-Executive Director
Sebastian Tan was appointed Independent Director of the Company in April 2013 and re-designated to Non-Executive Director of the Company in April 2024. In May 2000, he co-founded Boardroom Limited, a company listed on the Singapore Exchange (SGX-ST) and was delisted in August 2019. He was the Managing/Finance Director of Boardroom Limited from May 2000 to March 2013. Having retired from Boardroom Limited, he continues to be an Advisor. Prior to May 2000, he was with Ernst & Young Singapore and its affiliates since September 1973.
Sebastian is currently a Non-Executive Chairman of Vibrant Group Ltd, an Independent Non-Executive Chairman of Hiap Seng Industries Limited, and an Independent Director of Food Empire Holdings Limited and IPC Corporation Ltd. He is also a trustee of Kwan Im Thong Hood Cho Temple and a director of D S Lee Foundation. He is a qualified financial professional from the Association of Chartered Certified Accountants (UK). He was awarded the Public Service Medal in 1996.
Cynthia Tan Independent Director
Cynthia Tan was appointed Independent Director of the Company in November 2016. Prior to joining the board, she spent 16 years as the Executive Vice President, Head of Group Human Resources for OCBC Bank. In her earlier career, she headed the HR functions in LVMH/Duty-Free Group and Apple Computer Singapore. She was a former lecturer at Ngee Ann Polytechnic’s School of Business & Accountancy before joining the private sector.
Cynthia is currently an Independent Director of Valuemax Group Limited. She also serves as a Board member of the YMCA Singapore and DAS International Services Ltd. She is a Senior Fellow of The Conference Board.
Cynthia is a trained Executive Coach from Columbia University, US and certified Diversity Practitioner from Cornell University, US. She obtained her Doctorate in Business Administration from the Hong Kong Polytechnic University, Master in Gerontology from the University of Southampton, UK, Master of Business Administration from the University of Hull, UK, and Diploma in Personnel Management from the University of Cardiff, UK.
Derek Loh Independent Director
Derek Loh was appointed Independent Director of the Company in May 2021. He holds a Master of Arts (M.A.), Law (Honours) from the University of Cambridge, England and practises law in Singapore as an Executive Director of TSMP Law Corporation, specialising in construction and engineering law. He is an Advocate and Solicitor of the Supreme Court.
Derek currently serves as a Board member of the National Healthcare Group and the National Arts Council. He is a member of the Board of Governors of Saint Joseph's Institution International ("SJI") and also a trustee of the SJI Philanthropic Fund for the Lasallian Mission Ltd, a registered charity in Singapore.
Richard Tan Independent Director
Richard Tan was appointed Independent Director of the Company in May 2024. He was an Adjunct Associate Professor with the NUS Business School from 2016 to 2024. He retired as a Risk Consulting Partner with KPMG Singapore in 2015, having spent over 15 years across different periods where he was involved in a combination of external audit and risk advisory services. Richard also spent over 20 years in various international banks where he held senior positions in the areas of internal audit and operational risk management.
Richard is currently an Independent Director of First REIT Management Limited, Heeton Holdings Limited and QAE Limited. He also serves as a Board member of the Berjaya Sompo Insurance Berhad, Sompo Insurance Singapore Pte Ltd, Meranti Power Pte Ltd, Science Centre Board and Synapxe Pte Ltd. He is the Chairman of the Board of Trustees of The Brash Trust and a member of the Asia Advisory Board of EFG Bank AG.
Richard holds a Master of Business Administration from Henley Business School (Brunei University London), UK and is a member of The Association of Chartered Certified Accountants, Institute of Singapore Chartered Accountants, and Singapore Institute of Directors.
financial ratios
financial ratios /
Contact Us
The Kingsmen Experience
22 Changi Business Park Central 2
Singapore 486032
t. (65) 688 000 88
e. info@kingsmen-int.com
Contact Us
The Kingsmen Experience
22 Changi Business Park Central 2
Singapore 486032
t. (65) 688 000 88
e. info@kingsmen-int.com
Notes
Dates with early, mid or late descriptions are based on the dates from the previous year's results. These are not indicative of future result announcements dates.
Contact Us
The Kingsmen Experience
22 Changi Business Park Central 2
Singapore 486032
t. (65) 688 000 88
e. info@kingsmen-int.com
Historical EPS ($) a
NAV ($) b
Historical PE
Price / NAV b
Dividend ($) d 0.030
52 Weeks High
Dividend Yield (%) d
52 Weeks Low
Par Value ($)
Market Cap (M)
Issued & Paid-up Shares (excluding treasury shares) c
Notes
Based on latest Full Year results announcement, adjusted for the current number of shares (excluding treasury shares).
Based on latest results announcement (Full Year, Half Year or Interim), adjusted for the current number of shares (excluding treasury shares).
Rounded to the nearest thousand. Updated on 10/03/2026
Dividend is based on latest Full Year results announcement, adjusted for current number of shares (excluding treasury shares) and excludes special dividend.
Contact Us
The Kingsmen Experience
22 Changi Business Park Central 2
Singapore 486032
t. (65) 688 000 88
e. info@kingsmen-int.com
Announce Date [Date of Effective Change]
Buyer / Seller Name [Type*]
S / W / U **
Bought/ (Sold) ('000)
Price($)
After Trade
Note
No. of Shares ('000) ***
% Held ***
No Insider Trades Available.
*
DIR - Director (include Directors of related companies) SSH - Substantial Shareholder COY - Company Share Buyback TMRP - Trustee-Manager/Responsible Person
**
S - Shares W - Warrants U - Units R - Rights
***
Direct & Deemed Interests
Notes:
Only trades by directors, substantial shareholders and company share buy back are included in Insider Trades.
Contact Us
The Kingsmen Experience
22 Changi Business Park Central 2
Singapore 486032
t. (65) 688 000 88
e. info@kingsmen-int.com
TWENTY-THIRD ANNUAL GENERAL MEETING
The Twenty-Third Annual General Meeting (the “AGM”) of Kingsmen Creatives Ltd. (the “Company”) will be held at 22 Changi Business Park Central 2, The Kingsmen Experience, Singapore 486032 on Thursday, 30 April 2026 at 10.00 a.m..
Documents relating to the business of the AGM, which comprise the Annual Report of the Company for the financial year ended 31 December 2025 (the “Annual Report 2025”), the Circular to Shareholders in relation to the Proposed Renewal of the Share Purchase Mandate (the “Circular”), the Notice of AGM and the accompanying Proxy Form for the AGM (the “Proxy Form”) are provided below.
Printed copies of the Notice of AGM and Proxy Form will be mailed to shareholders of the Company (“Shareholders”).
Shareholders may request a printed copy of the Annual Report 2025 and the Circular by submitting the request to the Company via email at agm@kingsmen-int.com. For the request to be valid for processing, the Shareholder must specify “Request for Printed Copy of Annual Report 2025 and Circular” as the subject of the email, and for verification and mailing purposes, state his/her/its full name (as per The Central Depository (Pte) Limited records), identification number, contact number and mailing address.
The Group registered a year-to-date ("YTD") revenue of S$235.2 million for FY10 compared to S$242.0 million in FY09. The decrease of S$6.8 million or 2.8% in revenue was mainly due to lower revenue contribution from the Exhibitions & Museums division which is partially offset by better top-line performance from the Interiors division.
The Exhibitions & Museums division posted revenue of S$105.2 million compared with S$137.4 million in FY09. In FY09, about S$78 million of the division's revenue was contributed by a substantial project for Universal Studios Singapore which was completed and handed over in Dec 2009. Despite not having this one-off mega project in 2010, the division has done very well.
During the year, the division completed the works for seven pavilions at the World Expo Shanghai 2010 which contributed about S$25 million in revenue. The Group also successfully delivered the works for Singapore 2010 Youth Olympic Games, F1 Singapore Grand Prix, exhibition projects such as Food and Hotel Asia 2010, Singapore Airshow 2010, Tax Free Asia Pacific 2010, BMW Asia auto-show in Singapore and Nissan/Infiniti at various autoshows in China.
The Interiors division performed well with an increase in revenue of S$22.9 million or 24.5% to S$116.6 million as compared to S$93.7 million in FY09.
The opening of the second integrated resort at Marina Bay Sands during 2010 has boosted the division's revenue. We have completed more than 35 shops, many which were for world-renowned brands. These projects contributed about S$23 million to our revenue.
The division continues to sustain good revenue contributions from key customers and brand names and recurring revenue from the export of fixtures. Key contributors to revenue during FY10 include Aldo, Bottega Veneta, Chanel, Fendi, F J Benjamin, Hinckley, Luxury Venture, Polo Ralph Lauren, Swarovski and The Hour Glass. We have also fitted out several boutiques for Tiffany in Singapore and China and for Burberry in China, Mongolia, Vietnam and India.
The Research & Design division achieved growth of S$0.6 million or 11.7% in revenue to S$6.4 million in FY10 compared to S$5.8 million in same period last year. The increase is due to more design jobs undertaken in FY10, which is in tandem with the overall growth of the Group. Revenue from the IMC division increased from S$5.2 million to S$7.0 million.
Gross Profit
Gross profit increased by S$5.9 million or 9.9% to S$65.4 million in FY10 as compared to S$59.5 million in FY09. Gross profit margin also improved to 27.8% from 24.6%.
Other Income
Other income comprises items of corporate fees, insurance claims, rental income, jobs credit grant and other miscellaneous income.
Other Items of Expenses
Operating expenses increased by S$4.1 million from S$44.6 million for FY09 to S$48.7 million for FY10 due to the following: -
increase in staff salaries and related expenses of S$2.6 million to S$35.4 million;
increase in net foreign exchange loss of S$0.1 million to S$0.7 million;
increase in operating lease expenses of S$0.3 million to S$3.4 million;
increase in allowance for doubtful trade debts and bad trade debts written off of S$0.2 million; and
write-off of plant and property amounting to S$0.4 million as a result of the fire at our Malaysia factory premises.
Interest Income
This relates mainly to interest income derived from fixed deposits and bank balances with the banks.
Share of Results of Associates
Other than losses suffered by Kingsmen Middle East LLC and Kingsmen Nikko Limited, all other associated companies have reported positive earnings.
Net Profit after MI
The Group recorded a net profit after MI of S$15.1 million, an increase of 1.1% or S$0.2 million compared to S$14.9 million for FY09.